Facebook
 X
X
 Pinterest
 Copy Link


Don’t forget your blanket and the popcorn! It is the time of year when it’s nice enough to grab a movie outdoors – how fun! Here is a list of local outdoor movies planned for this summer.
South Snohomish
Arlington’s Old Time Movies
Terrace Park
7/6 Star Wars: The Last Jedi (at the Airport Fly In)
7/12 Early Man
7/19 Peter Rabbit
Edmond’s Outdoor Movie Night
Frances Anderson Center Field
7/27 Moana
8/3 Wonder
Everett’s Cinema Under the Stars
Thornton Sullivan Park, Camp Patterson Field
7/20 Early Man
7/27 Coco
8/3 Wonder
8/10 Moana
8/17 Guardians of the Galaxy Vol 2
Marysville Popcorn in the Park
Jennings Park, Lioins Centennial Pavilion
7/14 Despicable Me 3
7/21 Jumanji
7/28 Cars 3
8/4 Wonder Woman
8/11 Star Wars: The Last Jedi
Sundquist Family Movies in the Park
Willis Tucker Park
7/12 Jumanji
7/19 Ferdinand
7/26 The Greatest Showman
8/2 Coco
8/9 Wonder
8/16 Beauty and the Beast
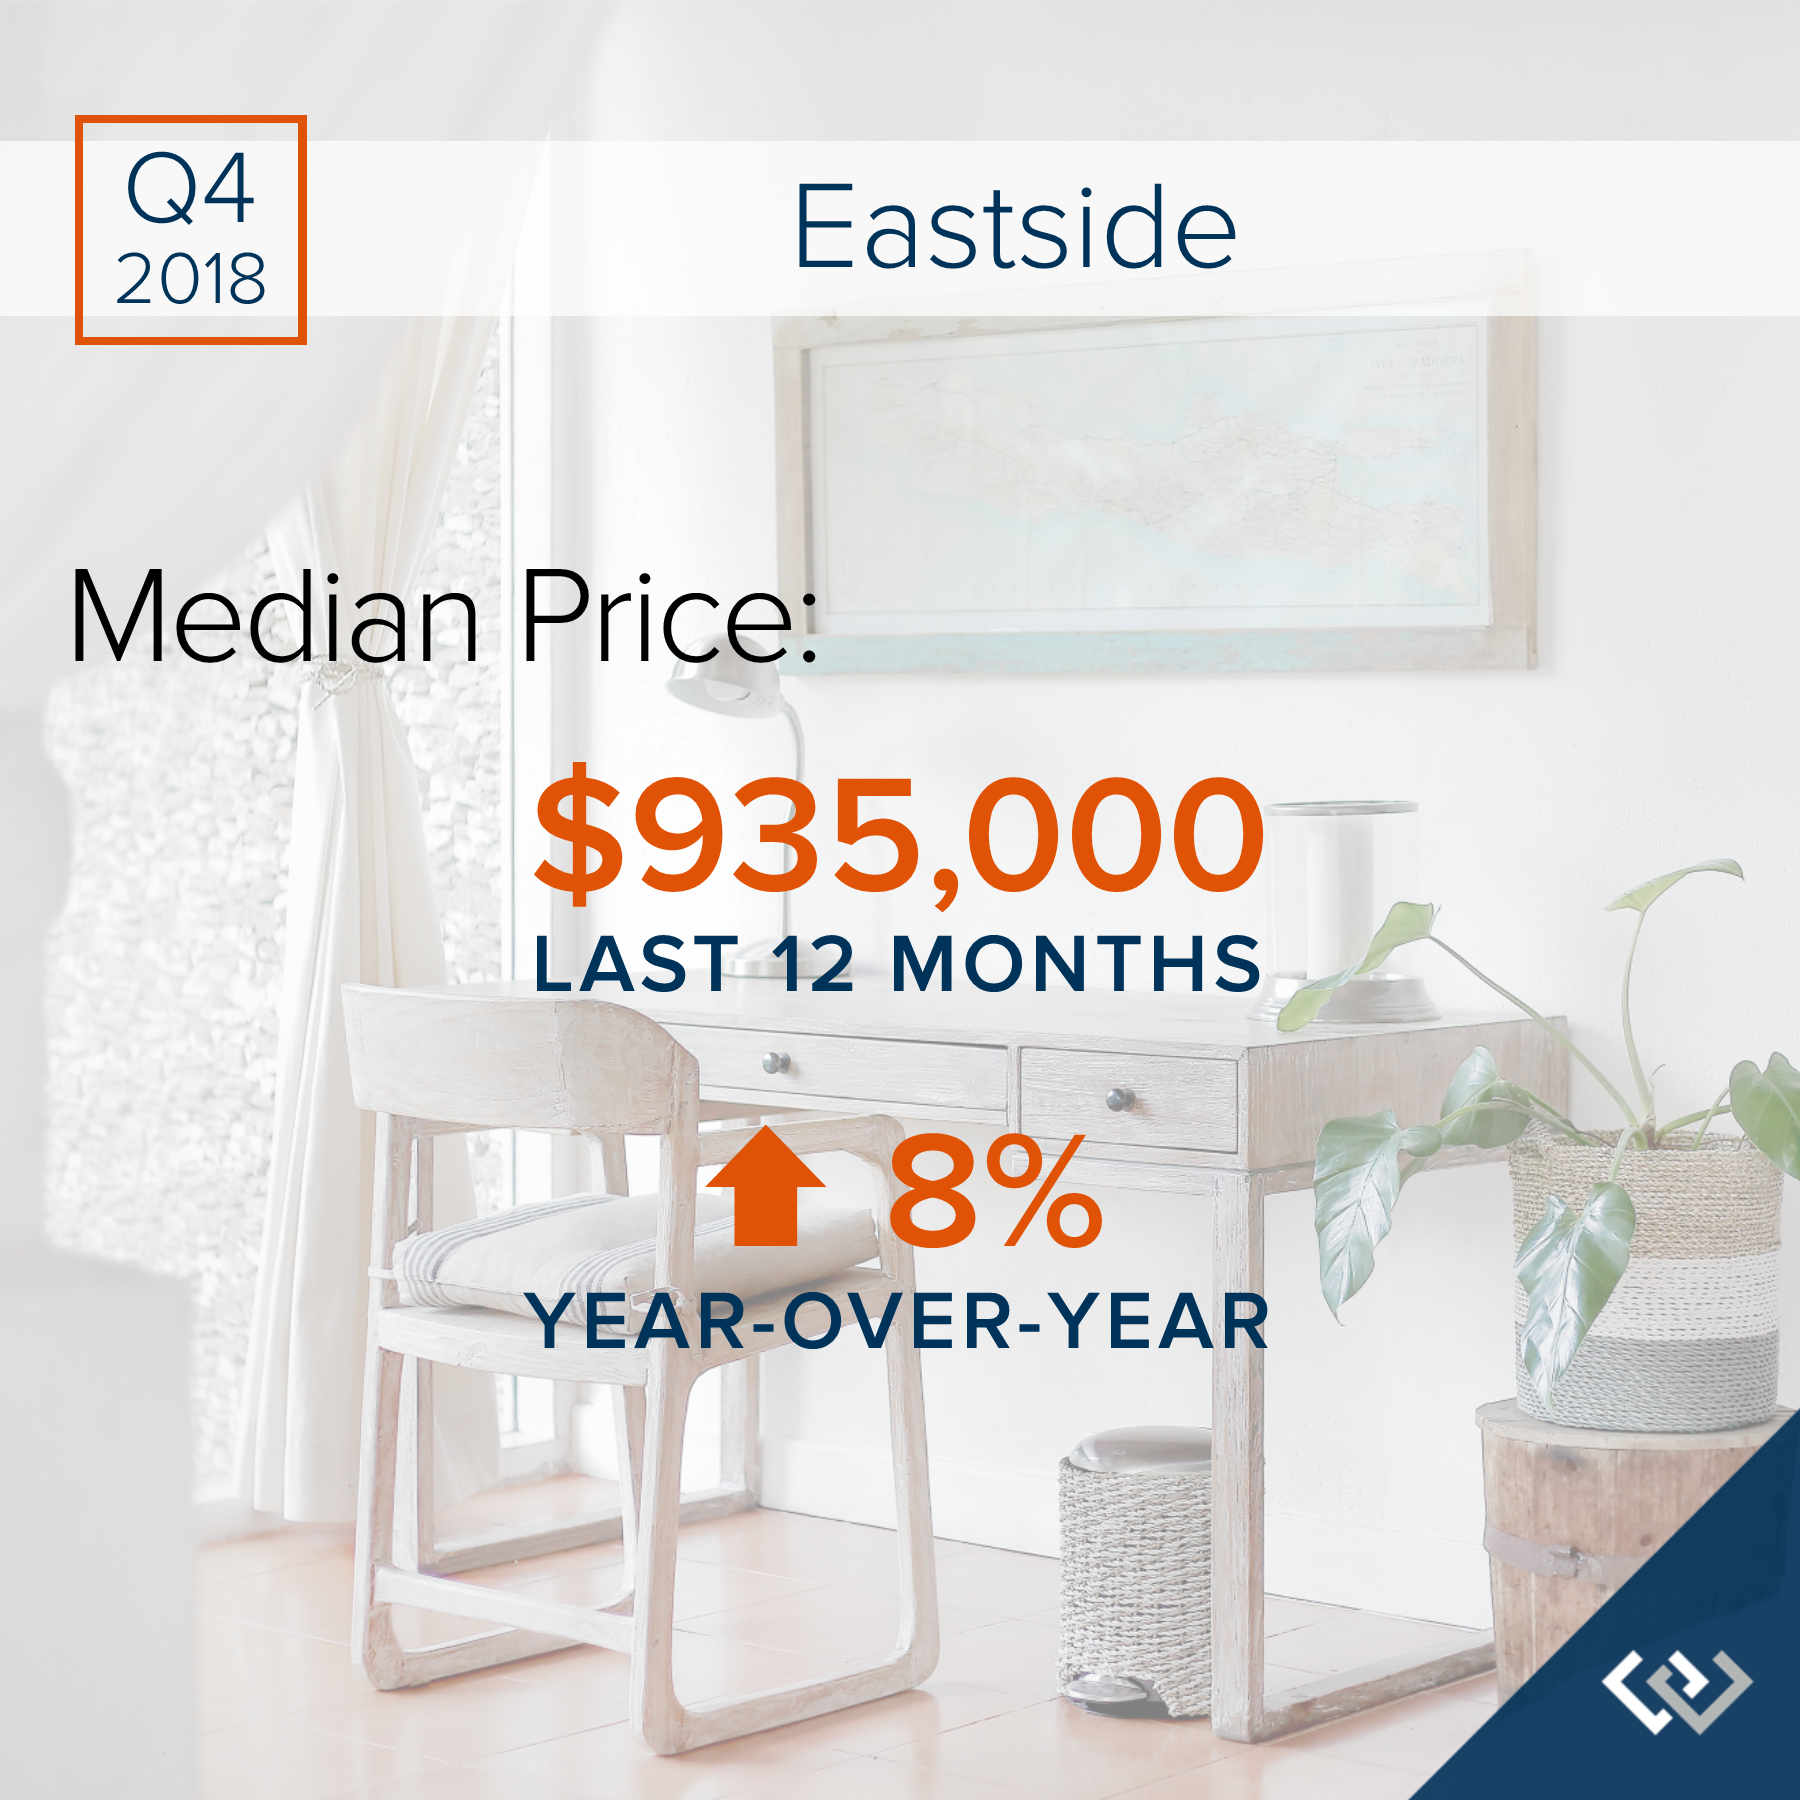
Eastside
Bellevue Movies in the Park
Downtown Park
7/10 Despicable Me 3
7/17 Boss Baby
7/24 The Lego Ninjago Movie
7/31 Goodbye Christopher Robin
8/7 Paddington 2
8/14 The Greatest Showman
8/21 Ferdinand
8/28 Ghostbusters
Crossroads Movies in the Park
Crossroads Park
8/2 TBD
8/9 TBD
8/16 TBD
8/23 TBD
Carillon Point Outdoor Movies
Carillon Point Plaza
7/7 Despicable Me 3
7/21 The Wedding Singer
8/4 Jumanji
8/18 Star Wars: The Last Jedi
Movies at Marymoor
Marymoor Park
6/28 The Goonies
7/5 Wonder Woman
7/11 Jumanji
7/18 Coco
7/25 The Greatest Showman
8/2 10 Things I Hate About You
8/8 Thor: Ragnarok
8/15 Ferdinand
8/22 Black Panther
8/29 The Princess Bride
Seattle Area
Bite of Seattle
Seattle Center Mural Amphitheatre
7/20 A League of Their Own
Cinema under the Stars
Columbia Park
7/14 Best of the Children’s International Film Festival
8/18 Coco
Movies at the Marina
Shilshole Bay Marina
8/3 Overboard
8/17 Moana
Movies at the Mural
Seattle Center Mural Amphitheatre
7/28 The Princess Bride
8/4 Get Out
8/11 Little Shop of Horrors
8/18 I am Not Your Negro
8/25 Wonder Woman
Seattle Outdoor Cinema
South Lake Union Discovery Center
6/16 The Goonies
7/21 Jurassic Park
8/25 Black Panther
West Seattle Outdoor Movies
Fauntleroy Triangle
7/21 Wonder Woman
7/28 The Secret Life of Pets
8/4 Star Wars: The Last Jedi
8/11 A Wrinkle in Time• Outdoor Movie Schedule: Summer 2018
Don’t forget your blanket and the popcorn! It is the time of year when it’s nice enough to grab a movie outdoors – how fun! Here is a list of local outdoor movies planned for this summer.
South Snohomish
Arlington’s Old Time Movies
Terrace Park
7/6 Star Wars: The Last Jedi (at the Airport Fly In)
7/12 Early Man
7/19 Peter Rabbit
Edmond’s Outdoor Movie Night
Frances Anderson Center Field
7/27 Moana
8/3 Wonder
Everett’s Cinema Under the Stars
Thornton Sullivan Park, Camp Patterson Field
7/20 Early Man
7/27 Coco
8/3 Wonder
8/10 Moana
8/17 Guardians of the Galaxy Vol 2
Marysville Popcorn in the Park
Jennings Park, Lioins Centennial Pavilion
7/14 Despicable Me 3
7/21 Jumanji
7/28 Cars 3
8/4 Wonder Woman
8/11 Star Wars: The Last Jedi
Sundquist Family Movies in the Park
Willis Tucker Park
7/12 Jumanji
7/19 Ferdinand
7/26 The Greatest Showman
8/2 Coco
8/9 Wonder
8/16 Beauty and the Beast
Eastside
Bellevue Movies in the Park
Downtown Park
7/10 Despicable Me 3
7/17 Boss Baby
7/24 The Lego Ninjago Movie
7/31 Goodbye Christopher Robin
8/7 Paddington 2
8/14 The Greatest Showman
8/21 Ferdinand
8/28 Ghostbusters
Crossroads Movies in the Park
Crossroads Park
8/2 TBD
8/9 TBD
8/16 TBD
8/23 TBD
Carillon Point Outdoor Movies
Carillon Point Plaza
7/7 Despicable Me 3
7/21 The Wedding Singer
8/4 Jumanji
8/18 Star Wars: The Last Jedi
Movies at Marymoor
Marymoor Park
6/28 The Goonies
7/5 Wonder Woman
7/11 Jumanji
7/18 Coco
7/25 The Greatest Showman
8/2 10 Things I Hate About You
8/8 Thor: Ragnarok
8/15 Ferdinand
8/22 Black Panther
8/29 The Princess Bride
Seattle Area
Bite of Seattle
Seattle Center Mural Amphitheatre
7/20 A League of Their Own
Cinema under the Stars
Columbia Park
7/14 Best of the Children’s International Film Festival
8/18 Coco
Movies at the Marina
Shilshole Bay Marina
8/3 Overboard
8/17 Moana
Movies at the Mural
Seattle Center Mural Amphitheatre
7/28 The Princess Bride
8/4 Get Out
8/11 Little Shop of Horrors
8/18 I am Not Your Negro
8/25 Wonder Woman
Seattle Outdoor Cinema
South Lake Union Discovery Center
6/16 The Goonies
7/21 Jurassic Park
8/25 Black Panther
West Seattle Outdoor Movies
Fauntleroy Triangle
7/21 Wonder Woman
7/28 The Secret Life of Pets
8/4 Star Wars: The Last Jedi
8/11 A Wrinkle in Time
8/18 Coco
8/25 Black Panther
*Check websites for start times, pre-movie activities and to make sure your favorite movie hasn’t been canceled or changed!
8/18 Coco
8/25 Black Panther
*Check websites for start times, pre-movie activities and to make sure your favorite movie hasn’t been canceled or changed!


 A happy family of five just moved in to this house earlier this month. Two hard working parents, Brandy and Juan, with three teenagers were renting a 3-bedroom, 1-bath rambler in Edmonds and needed more space. It was time to make a move, and they had saved up a 3% down payment for a new home. Their budget was $400,000.
 The first step in the home buying process was sitting down with their agent for the initial buyer consultation. This is where they discussed market conditions, desired features such as bedrooms, bathrooms and garage, and their budget. This lead them to explore which locations had the inventory that met their needs in order to stay within their budget. They had to marry these three key points – we like to call this the Triangle of Buyer Clarity. They then identified a few workable locations that had inventory which supported their desired features and their budget and went for it. This upfront research and partnership with their agent lead to Brandy and Juan finding success rather quickly, saving them money in an appreciating market, and a whole lot of strife.
 First, how cool is this house? Super cool! That’s just how Paul and Ange feel about their newly purchased home in the Highland Park neighborhood of West Seattle. They just closed in early April and have already attended two neighborhood BBQ’s, received gifts from their new neighbors, discovered new parks and restaurants and, wait for it…shortened their commute.
 The point of these two stories is to debunk the sentiment we hear from time to time, that first-time home buyers cannot find success in our market. With a well-laid-out plan strategically constructed by the agent and client, we are seeing many happy stories for first-timers. The end result is putting these new homeowners on the path to building wealth, growing thriving communities, and making their house their home.


 Now that the 2017 tax deadline has come and gone it is time to think about how the new tax reform of 2018 might affect you next year. A few notable items are the limited mortgage interest rate deduction capped at $750,000, limited property tax deduction capped at $10,000 and moving expenses can only be written off by members of the armed services.