I hope your Valentine’s Day was a sweet one, but it got me thinking. I am often sharing with you the advantages of this market for home sellers, which is unbelievably positive. With that said, I thought I’d take some time to give the potential buyers in our marketplace some love, hope, and of course, data!
Dear Greater Seattle Home Buyer,
Let’s just be up front: buying a home in today’s market is not easy. Quite frankly, it can be a wild roller coaster ride with twists and turns; but remember, folks pay a lot of money and stand in long lines for roller coaster rides. Imagine the excited pit in your stomach as the cart clicks up to the highest point before you plunge down a steep drop, and the thrill of raising your hands up because you trust that you are going to be okay. These emotions also accurately reflect the feelings of today’s home buyer – it can be a wild ride! Let’s also note that many roller coaster riders return to the back of the line right after getting off. Home ownership is also a good exercise to repeat and is often the investment that leads to the most built wealth in one’s life.
So how does one ensure that they are not the Nervous Nelly who stands in line for over an hour, finally makes it to the front to be strapped in to the cart, but who then chooses to bow out? The one that sits on the sidelines watching others throw up their hands with a thrill in their eye; the one with that tinge of regret as their friends rejoin them back on hallowed ground to recount their adventure. Wow, this is getting dramatic! Here are a few tips to follow that will ensure that one can find success securing a home in today’s market and get on the equity building train.
Waiting is Even More Expensive
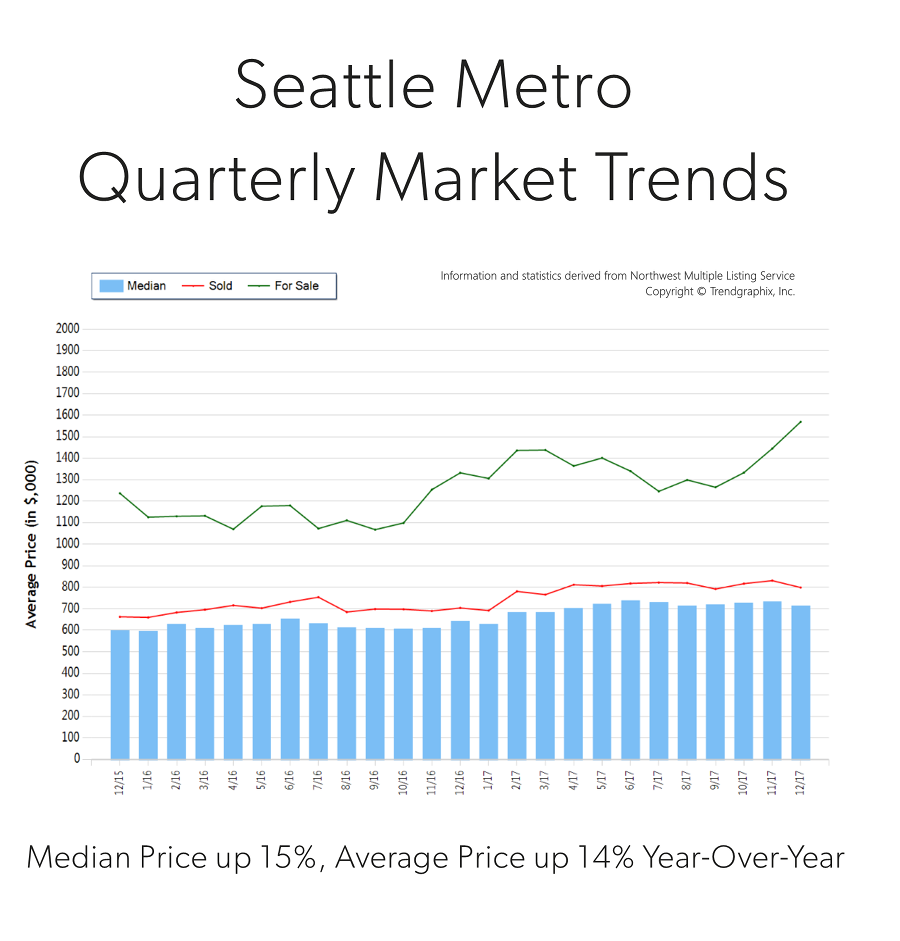
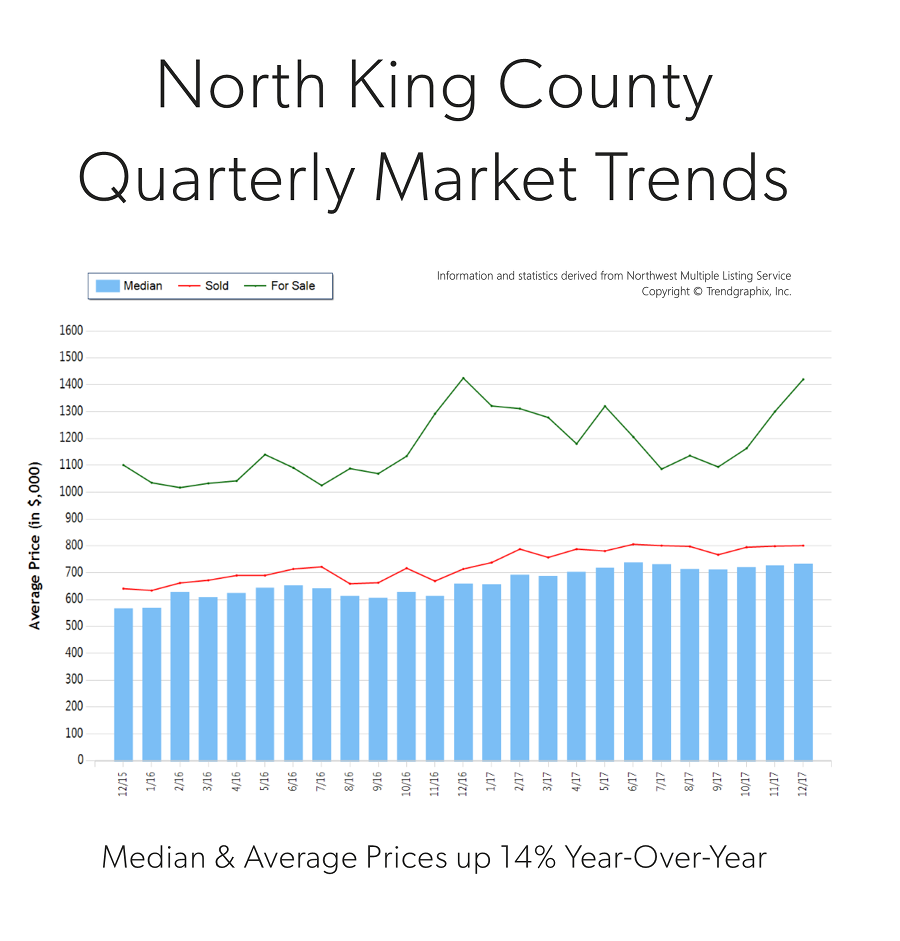
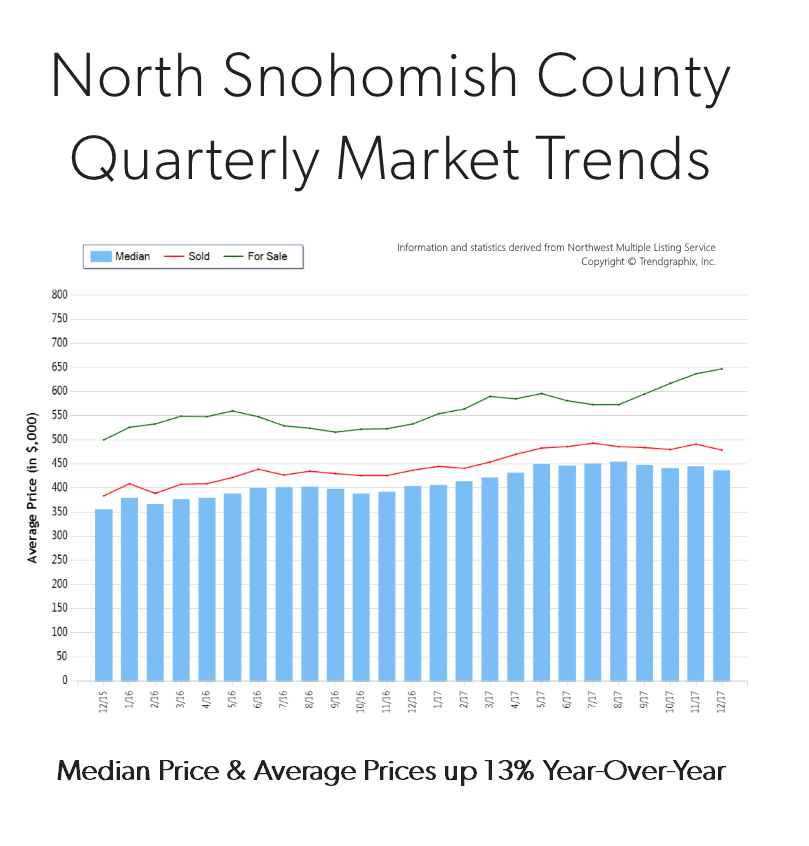
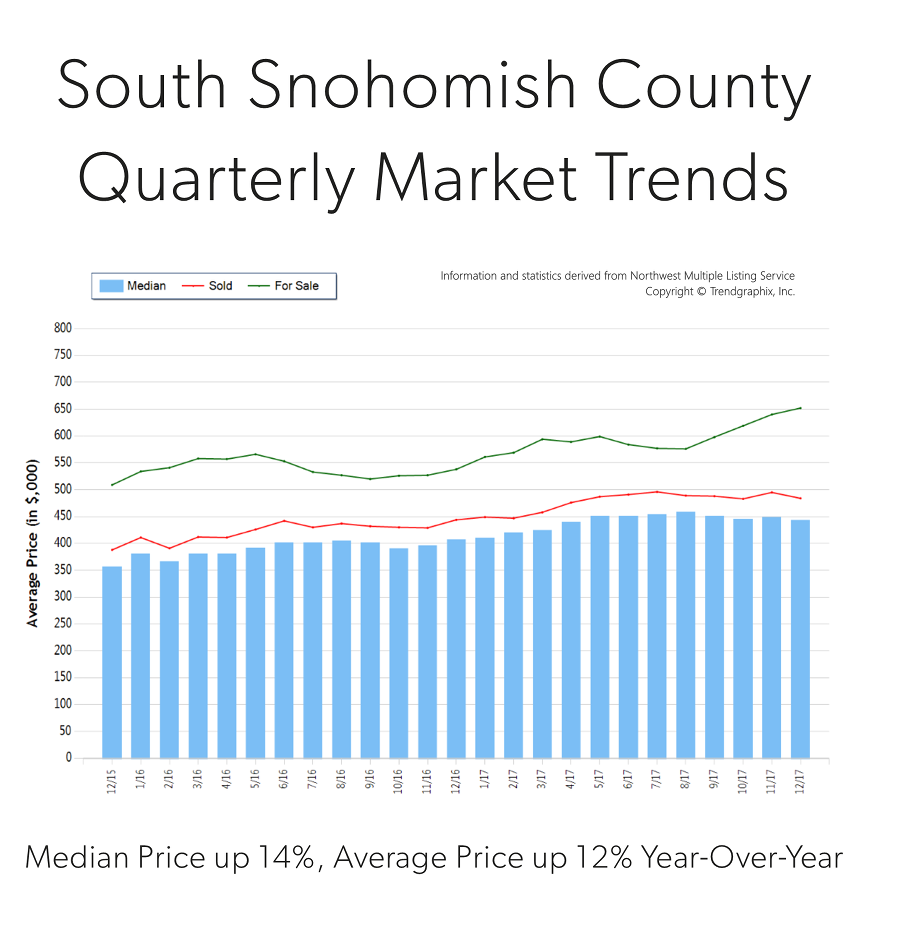
In 2017, the year-over-year median price gains across our region were strong. In fact, here is a little break down.
| North Snohomish County: |
$371,000 |
up 13% |
| South Snohomish County: |
$508,000 |
up 14% |
| North King County: |
$715,000 |
up 14% |
| Seattle Metro: |
$710,000 |
up 15% |
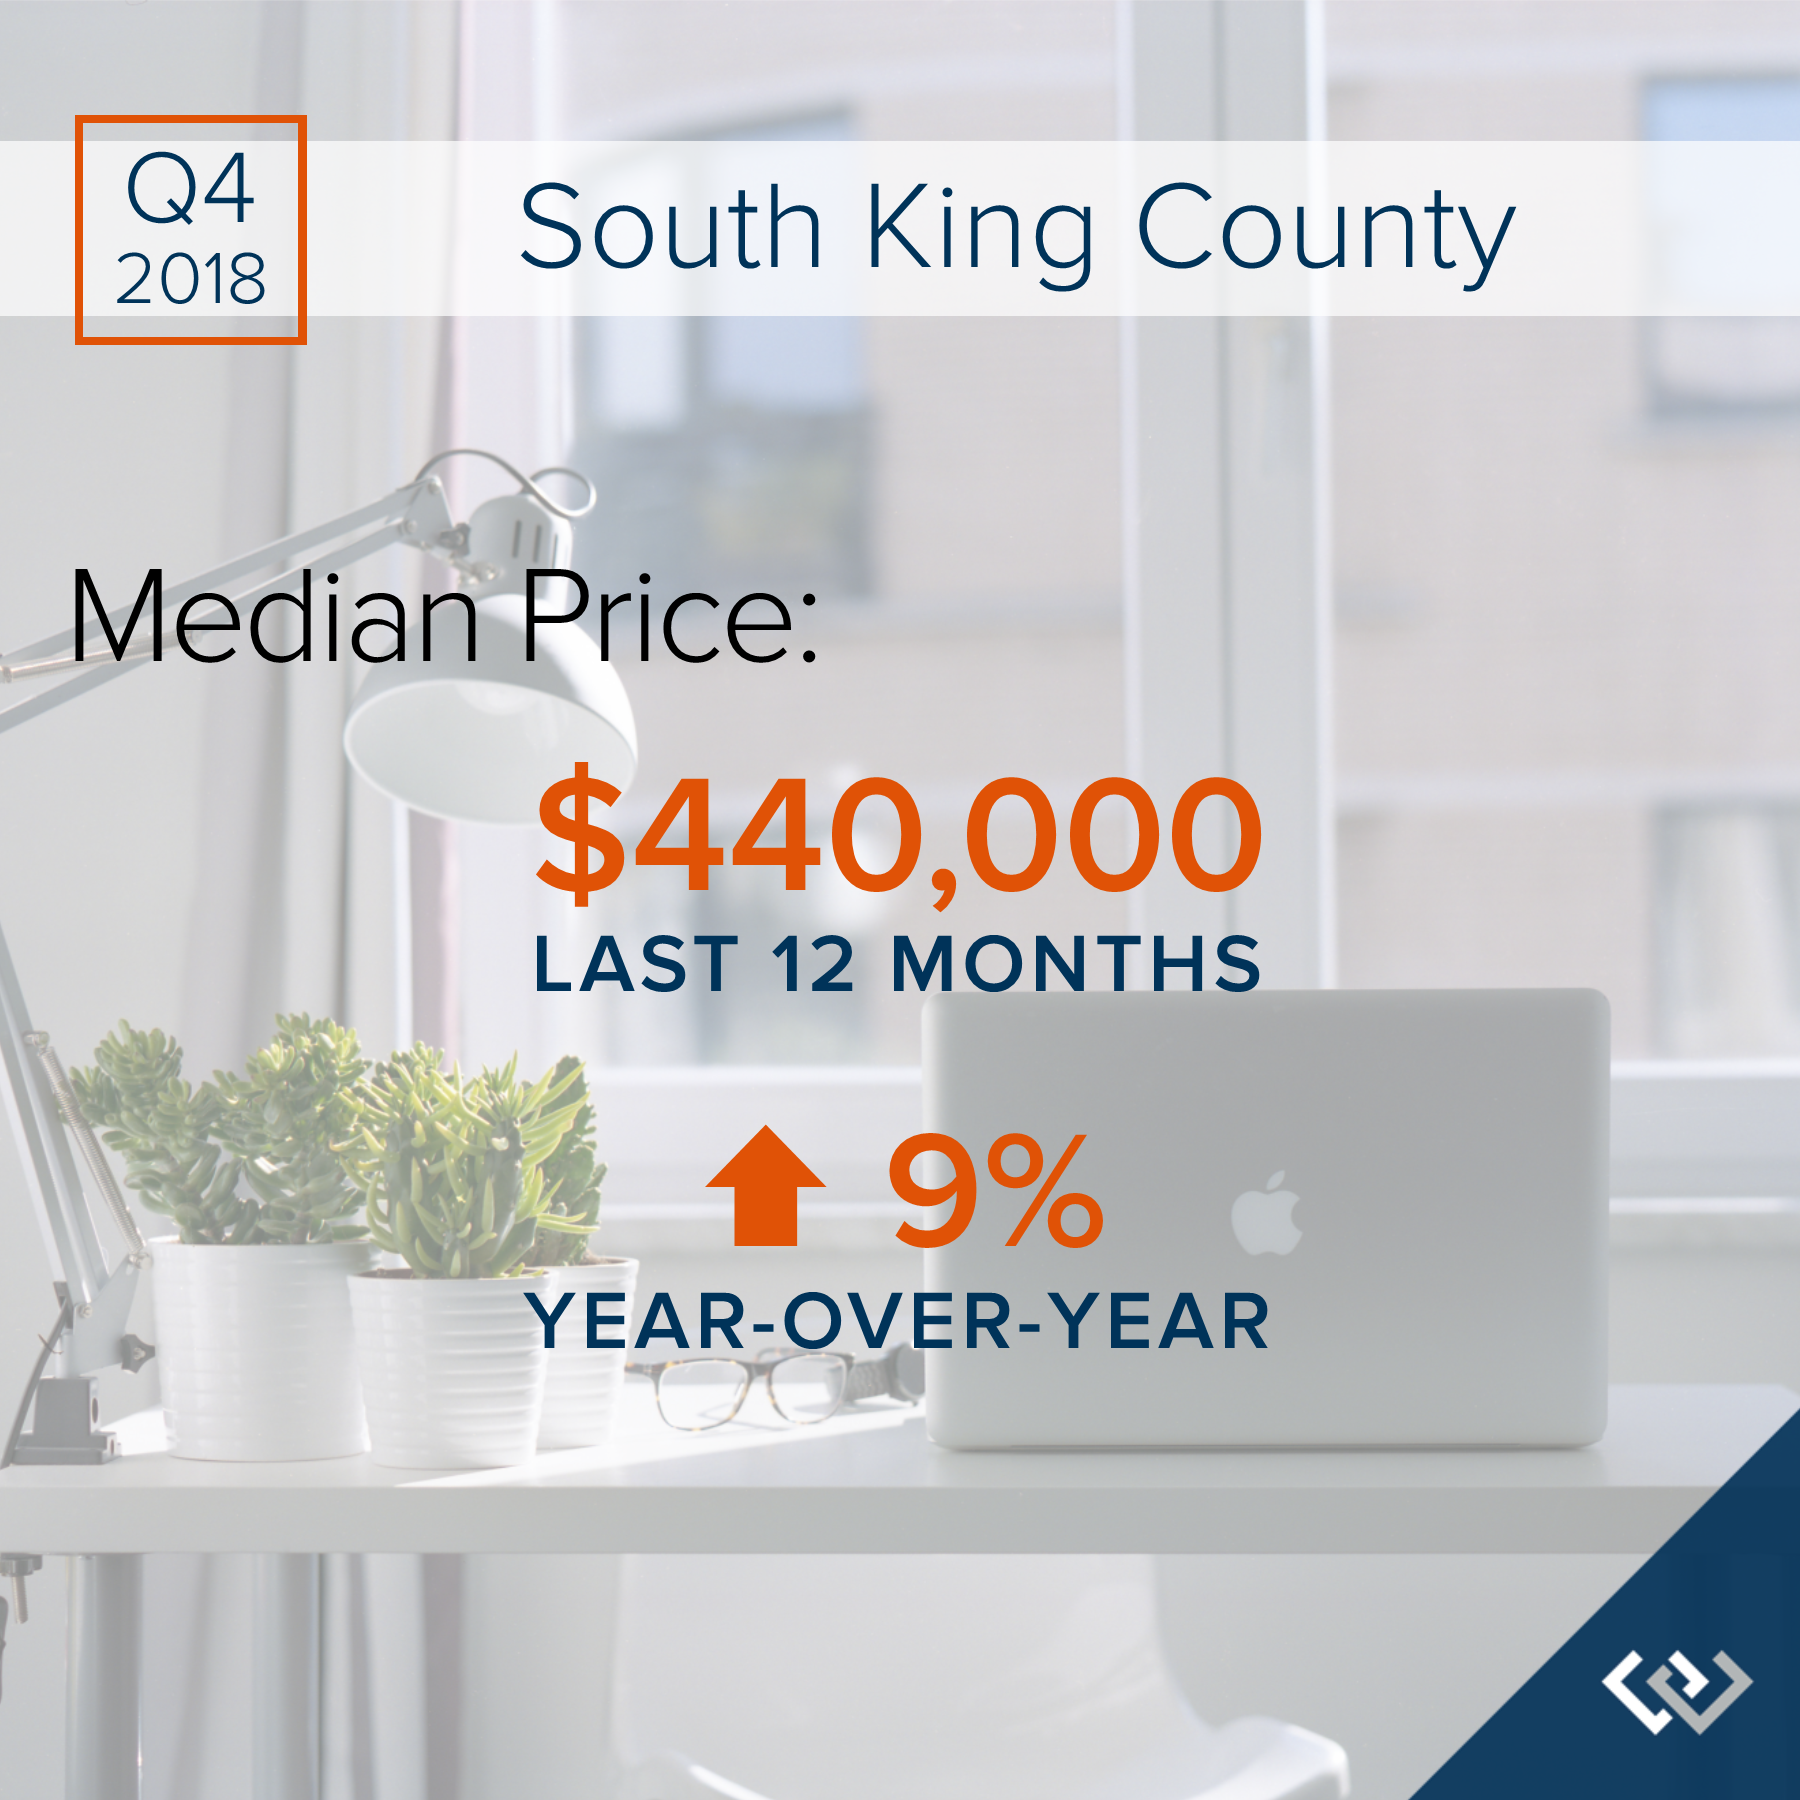
| South King County: |
$405,000 |
up 13% |
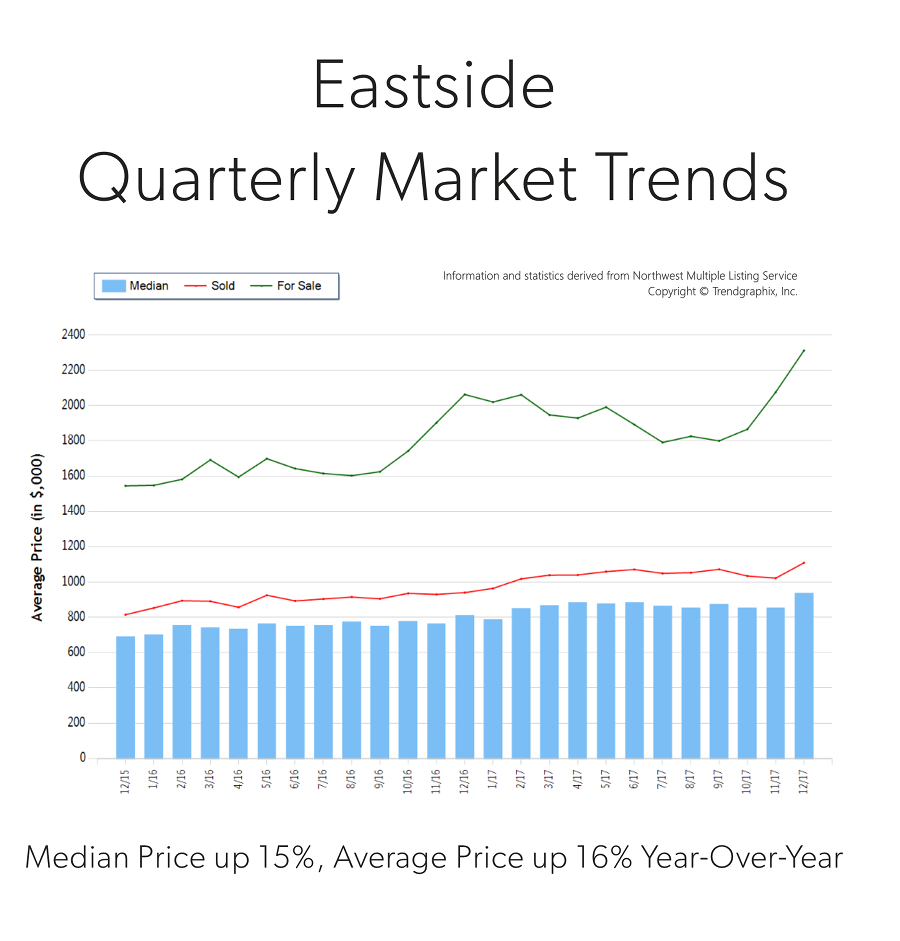
| Eastside: |
$865,000 |
up 15% |
The appreciation is for real and as each month ticks by, prices are going up. That is why it is incredibly important to have a plan and realistic expectations. In referring to the chart above, it is plain to see the affordability of each area. Buyers have had to get creative and honest with themselves regarding the city or neighborhood in which they land. Commute times are one of the biggest indicators of home cost. It is paramount to line your budget up with a realistic commute time and then dig in. Too often I’ve seen buyers tightly grip to the idea of an in-city commute, only to have it end up being a more suburban choice in the end. The months wasted trying to perform in a market that didn’t match their budget ended up costing them at least 1% a month, based on last year’s appreciation. Getting real saves time, money, and heartache.
Interest Rates are a’Rising
This aspect is actually one to pay very close attention to. We have been amazingly spoiled with historically low interest rates over the last five years. In fact, there is an entire generation of buyers who only know rates that have hovered from 3.5 – 4.5% – that is close to 3 points under the 30-year average! A good rule of thumb regarding interest rates, is that for each 1-point increase a buyer loses 10% of their buying power. That means that if you have a $500,000 budget and the rate goes up by a point, that you are now shopping for a $450,000 house if you want the same payment. Note, that shift does not take appreciation into consideration. Today’s rates have helped buyers bear the home prices in our area. It is predicted that rates will rise in 2018 by .5 to 1%.
Rents are High and Don’t Build Wealth
Seattle is now the 5th most expensive city to rent in the country according to the US Census Bureau. With rising rental rates, still historically low interest rates, and home prices on the rise, the advantage of buying versus renting has become clear for folks who have a down payment saved, good debt-to-income ratios and strong credit. Currently, the breakeven horizon (the amount of time you need to own your home in order for owning to be a superior financial decision vs. renting) in the Greater Seattle area is 1.6 years according to Zillow research.
Partner with a Broker Who Will Get the Job Done
A broker that has a process is key! It starts with an initial buyer consultation. I liken the buyer consultation to the seat belt you would wear on the roller coaster ride. When you go to the Dr. they start with your intake, check your vitals, ask questions, etc. The buyer consultation aims to unearth a buyer’s goals, research the areas they are interested in, address financing, and illustrate the challenges of the environment, so one can be successful. Time is money, and this consultation brings clarity, efficiency and trust. This upfront education coupled with a high level of communication and availability is paramount. The depth of the relationship will lead to success, and is the ingredient that enables a buyer to throw up their hands and take the thrilling plunge. It is hard to do that without a seat belt!
Get Your Finances in Order
Aligning with a trusted real estate professional is key, but so is aligning with a reputable and responsive mortgage lender. Getting pre-approved is the minimum, but getting pre-underwritten is a game changer. Finding a lender that is willing to put in the work up-front to vet credit, income, savings, debt, and all other financial indicators will lead to being pre-underwritten, which listing agents and sellers appreciate! Also, be aware that you do not always need to have a huge down payment to make a purchase work. Employment, assets, credit, and what you have saved all work into your ability to acquire a loan. I have seen plenty of people secure a home with 3-5% down. Education and awareness create clarity, and investing into understanding your financial footing equals empowered and more efficient decisions. Note that I mentioned “responsive”. This is a 24/7 market, and lenders who don’t work evenings and weekends can get in the way of a buyer securing a home. If you need a short list of lenders that fit this description, please contact me.
‘Tis the Season – Inventory is Coming
Have hope! This is the time of year where we see inventory climb month over month. There will be more selection, but bear in mind it is also the time of year that the appreciation push happens. If you are feeling 75-80% in love with a home, it is one to act on. You’re never going to “get it all”, so a willingness to focus on priorities will pay off, because waiting will have an expense.
If you or someone you know is considering a purchase in today’s market, please contact me. It is my pleasure to take the time to educate, devise a plan, and help buyers find success in a challenging, yet advantageous market.

 Facebook
 X
X
 Pinterest
 Copy Link